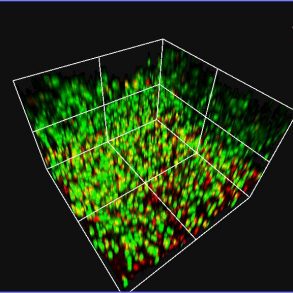
A 3D bioprinted cellular scaffold that can be detected through non-invasive MRI imaging post-implantation. The green dots represent live cells and the red dots represent dead cells. The scaffold is labelled with a contrast agent that gives off a bright signal when imaged by MRI.

In-vivo cellular assembly of magnetic particles for bright-contrast cell tracking on MRI

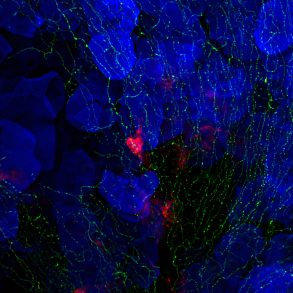
The image of center of cornea. color green is axons, blue is stem cells, red is Schwann cells.

From Concept to Clinic

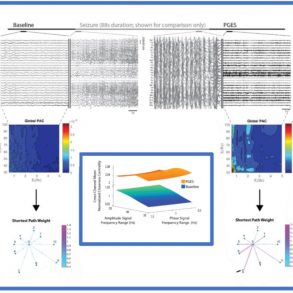
Phase-amplitude cross -frequency coupling (PAC) analysis of EEG in a patient with epilepsy shows that a state of postictal generalized EEG suppression (PGES) has increased delta-gamma coupling over baseline. Simultaneous scalp and intracranial EEG was recorded. The top figure shows scalp EEG traces of a baseline, seizure onset, seizure offset and a following PGES state - seizure duration of 88 seconds, baseline 100 seconds before onset, PGES state begins 15 seconds after the seizure. Global PAC comparison between baseline and PGES states is shown below. Closeness centrality (CC) of intracranial EEG networks is elevated for PGES state versus baseline. as shown for baseline vs PGES state for this Patient. Network consists of outward shortest-path connections for the median channel (3), normalized to the PGES state. Edge length is scaled by physical distance in the iEEG bipolar montage, and color and line width is scaled by the connection strength. The middle figure shows summary of networks for all channel pairings for this patient , using cross-channel mean of closeness centrality. Here, it is shown as a function of PAC frequency ranges and normalized to the median of the baseline.

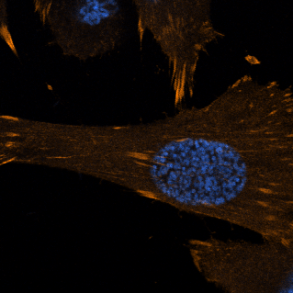
Mouse muscle stem cell focal adhesions (orange) and nucleus DNA (blue).

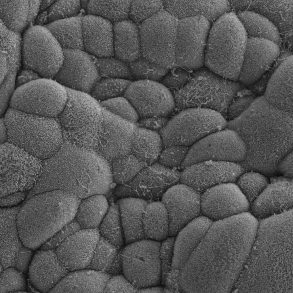
Airway epithelial cells were cultured on a suspended hydrogel that is integrated into a channel of a microfluidic device. After precisely controlled airflow was exposed on the cells, cells began to grow cilia that mimicked the native airway epithelium. The image was taken with a scanning electron microscope. (Magnification: 5000x)

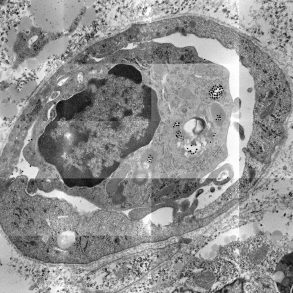
Gold nanoparticles are taken up by an immune cell inside a tumour microvessel. We are looking at the cross-section of a microvessel inside a mouse melanoma tumour. The image was acquired using an electron microscope that provides sub-nanometer resolution, so that we can visualize where our gold nanoparticles (the black dots) are located. Here, the nanoparticles have been "eaten" by an immune cell and are stored in organelles called lysosomes. Around them are endothelial cells forming the vessel wall, outside of which is the cancer tissue. Techniques such as electron microscopy help us study how nanoparticles interact with the biological system.

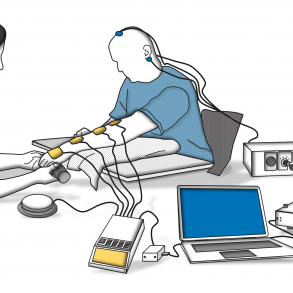
The concept illustration of the brain-computer interface-controlled functional electrical stimulation therapy, or BCI-FEST for shorter. BCI-FEST is a novel rehabilitation strategy for the recovery of voluntary arm and hand motor function after stroke or spinal cord injury. The therapist (left) guides the patient (right) in performing functional movements assisted by electrical stimulation. During therapy, the patient uses the BCI to control the stimulation with their electrical brain activity.

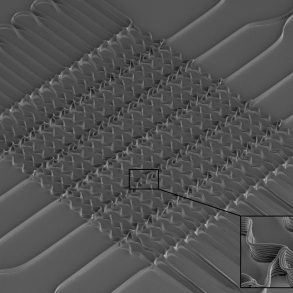
Scaffolds composed of stacked layers of orthogonally-oriented sinusoidal fibres can exhibit non-linear anisotropic mechanical properties, similar to those of native heart valve tissue. These scaffolds are fabricated via melt electrospinning writing of polycaprolactone for heart valve tissue engineering applications.

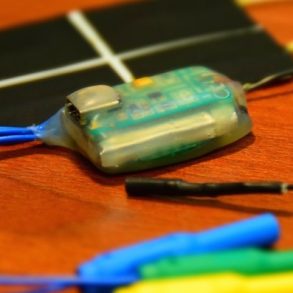
A prototype for a device that improves muscle fatigue resistance in any electrical stimulation application. The device splits the electrical stimulation pulse into four and delivers it non-sequentially to muscles. This device has the potential to triple muscle endurance during electrical stimulation and greatly increase electrical stimulation effectiveness.
